(6) 欧洲战争的轨迹 The Trajectory of European War | 人性中的善良天使
1 / 7
The extensive historical data from Europe also give us an opportunity to broaden our view of organized conflict from interstate wars involving the great powers to wars between less powerful nations, conflicts that miss the thousand-death cutoff, civil wars, and genocides, together with deaths of civilians from famine and disease. What kind of picture do we get if we aggregate these other forms of violence -- the tall spine of little conflicts as well as the long tail of big ones?
查看中文翻译
Wars involving great powers offer a circumscribed but consequential theater in which we can look at historical trends in war. Another such theater is Europe. Not only is it the continent with the most extensive data on wartime fatalities, but it has had an outsize influence on the world as a whole. During the past half-millennium, much of the world has been part of a European empire, and the remaining parts have fought wars with those empires. And trends in war and peace, no less than in other spheres of human activity such as technology, fashion, and ideas, often originated in Europe and spilled out to the rest of the world.
查看中文翻译
(6) 欧洲战争的轨迹 The Trajectory of European War | 人性中的善良天使
2 / 7
The political scientist Peter Brecke is compiling the ultimate inventory of deadly quarrels, which he calls the Conflict Catalog. His goal is to amalgamate every scrap of information on armed conflict in the entire corpus of recorded history since 1400. Brecke began by merging the lists of wars assembled by Richardson, Wright, Sorokin, Eckhardt, the Correlates of War Project, the historian Evan Luard, and the political scientist Kalevi Holsti. Most have a high threshold for including a conflict and legalistic criteria for what counts as a state. Brecke loosened the criteria to include any recorded conflict that had as few as thirty-two fatalities in a year (magnitude 1.5 on the Richardson scale) and that involved any political unit that exercised effective sovereignty over a territory. He then went to the library and scoured the histories and atlases, including many published in other countries and languages. As we would expect from the power-law distribution, loosening the criteria brought in not just a few cases at the margins but a flood of them: Brecke discovered at least three times as many conflicts as had been listed in all the previous datasets combined. The Conflict Catalog so far contains 4,560 conflicts that took place between 1400 CE and 2000 CE (3,700 of which have been entered into a spreadsheet), and it will eventually contain 6,000. About a third of them have estimates of the number of fatalities, which Brecke divides into military deaths (soldiers killed in battle) and total deaths (which includes the indirect deaths of civilians from war-caused starvation and disease). Brecke kindly provided me with the dataset as it stood in 2010.
查看中文翻译
(6) 欧洲战争的轨迹 The Trajectory of European War | 人性中的善良天使
3 / 7
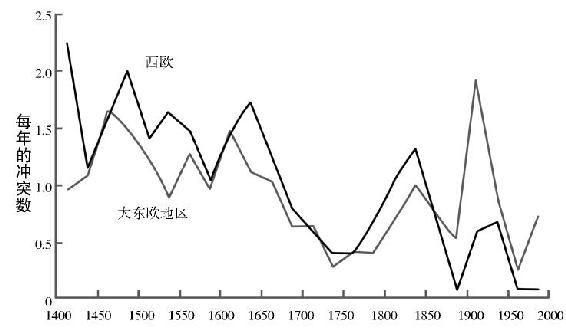
Let's start by simply counting the conflicts -- not just the wars embroiling great powers, but deadly quarrels great and small. These tallies, plotted in figure 5-17, offer an independent view of the history of war in Europe.
查看中文翻译
Once again we see a decline in one of the dimensions of armed conflict: how often they break out. When the story begins in 1400, European states were starting conflicts at a rate of more than three a year. That rate has caromed downward to virtually none in Western Europe and to less than one conflict per year in Eastern Europe. Even that bounce is a bit misleading, because half of the conflicts were in countries that are coded in the dataset as "Europe" only because they were once part of the Ottoman or Soviet empire; today they are usually classified as Middle Eastern or Central and South Asian (for example, conflicts in Turkey, Georgia, Azerbaijan, Dagestan, and Armenia). The other Eastern European conflicts were in former republics of Yugoslavia or the Soviet Union. These regions -- Yugoslavia, Russia/USSR, and Turkey -- were also responsible for the spike of European conflicts in the first quarter of the 20th century.
查看中文翻译
(6) 欧洲战争的轨迹 The Trajectory of European War | 人性中的善良天使
4 / 7
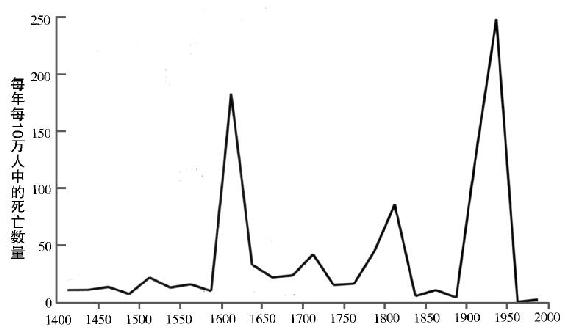
What about the human toll of the conflicts? Here is where the capaciousness of the Conflict Catalog comes in handy. The power-law distribution tells us that the biggest of the great power wars should account for the lion's share of the deaths from all wars -- at least, from all wars that exceed the thousand-death cutoff, which make up the data I have plotted so far. But Richardson alerted us to the possibility that a large number of smaller conflicts missed by traditional histories and datasets could, in theory, pile up into a substantial number of additional deaths (the gray bars in figure 5-11). The Conflict Catalog is the first long-term dataset that reaches down into that gray area and tries to list the skirmishes, riots, and massacres that fall beneath the traditional military horizon (though of course many more in the earlier centuries may never have been recorded). Unfortunately the catalog is a work in progress, and at present fewer than half the conflicts have fatality figures attached to them. Until it is completed, we can get a crude glimpse of the trajectory of conflict deaths in Europe by filling in the missing values using the median of the death tolls from that quarter-century. Brian Atwood and I have interpolated these values, added up the direct and indirect deaths from conflicts of all types and sizes, divided them by the population of Europe in each period, and plotted them on a linear scale. Figure 5-18 presents this maximalist (albeit tentative) picture of the history of violent conflict in Europe:
查看中文翻译
(6) 欧洲战争的轨迹 The Trajectory of European War | 人性中的善良天使
5 / 7
Sources: Conflict Catalog, Brecke, 1999; Long & Brecke, 2003. The conflicts are aggregated over 25-year periods and include interstate and civil wars, genocides, insurrections, and riots. "Western Europe" includes the territories of the present-day U. K., Ireland, Denmark, Sweden, Norway, France, Belgium, Luxembourg, Netherlands, Germany, Switzerland, Austria, Spain, Portugal, and Italy. "Eastern Europe" includes the territories of the present-day Cyprus, Finland, Poland, Czech Republic, Slovakia, Hungary, Romania, the republics formerly making up Yugoslavia, Albania, Greece, Bulgaria, Turkey (both Europe and Asia), Russia (Europe), Georgia, Armenia, Azerbaijan, and other Caucasus republics.
查看中文翻译
The scaling by population size did not eliminate an overall upward trend through 1950, which shows that Europe's ability to kill people outpaced its ability to breed more of them. But what really pops out of the graph are three hemoclysms. Other than the quarter-century containing World War II, the most deadly time to have been alive in Europe was during the Wars of Religion in the early 17th century, followed by the quarter with World War I, then the period of the French Revolutionary and Napoleonic Wars.
查看中文翻译
FIGURE 5-17: Conflicts per year in greater Europe, 1400-2000
查看中文翻译
(6) 欧洲战争的轨迹 The Trajectory of European War | 人性中的善良天使
6 / 7
Sources: Conflict Catalog, Brecke, 1999; Long & Brecke, 2003. Figures are from the "Total Fatalities" column, aggregated over 25-year periods. Redundant entries were eliminated. Missing entries were filled in with the median for that quarter-century. Historical population estimates are from McEvedy & Jones, 1978, taken at the end of the quarter-century. "Europe" is defined as in figure 5-17.
查看中文翻译
FIGURE 5-18: Rate of death in conflicts in greater Europe, 1400-2000
查看中文翻译
How can we make sense of the various slow drifts and sudden lurches in violence during the past half-millennium among the great powers and in Europe? We have reached the point at which statistics must hand the baton over to narrative history. In the next sections I'll tell the story behind the graphs by combining the numbers from the conflict-counters with the narratives from historians and political scientists such as David Bell, Niall Ferguson, Azar Gat, Michael Howard, John Keegan, Evan Luard, John Mueller, James Payne, and James Sheehan.
查看中文翻译
The career of organized violence in Europe, then, looks something like this. There was a low but steady baseline of conflicts from 1400 to 1600, followed by the bloodbath of the Wars of Religion, a bumpy decline through 1775 followed by the French troubles, a noticeable lull in the middle and late 19th century, and then, after the 20th-century Hemoclysm, the unprecedented ground-hugging levels of the Long Peace.
查看中文翻译
(6) 欧洲战争的轨迹 The Trajectory of European War | 人性中的善良天使
7 / 7
Here is a preview. Think of the zigzags in figure 5-18 as a composite of four currents. Modern Europe began in a Hobbesian state of frequent but small wars. The wars became fewer in number as political units became consolidated into larger states. At the same time the wars that did occur were becoming more lethal, because of a military revolution that created larger and more effective armies. Finally, in different periods European countries veered between totalizing ideologies that subordinated individual people's interests to a utopian vision and an Enlightenment humanism that elevated those interests as the ultimate value.
查看中文翻译