(3) 对致命争斗的统计:第一集,战争的时机 The Statistics of Deadly Quarrels, Part 1: the Timing of Wars | 人性中的善良天使
1 / 22
After poring through encyclopedias and histories of different regions of the world, Richardson compiled data on 315 "deadly quarrels" that ended between 1820 and 1952. He faced some daunting problems. One is that most histories are sketchy when it comes to numbers. Another is that it isn't always clear how to count wars, since they tend to split, coalesce, and flicker on and off. Is World War II a single war or two wars, one in Europe and the other in the Pacific? If it's a single war, should we not say that it began in 1937, with Japan's full-scale invasion of China, or even in 1931, when it occupied Manchuria, rather than the conventional starting date of 1939? "The concept of a war as a discrete thing does not fit the facts," he observed. "Thinginess fails."
查看中文翻译
Lewis Richardson wrote that his quest to analyze peace with numbers sprang from two prejudices. As a Quaker, he believed that "the moral evil in war outweighs the moral good, although the latter is conspicuous." As a scientist, he thought there was too much moralizing about war and not enough knowledge: "For indignation is so easy and satisfying a mood that it is apt to prevent one from attending to any facts that oppose it. If the reader should object that I have abandoned ethics for the false doctrine that 'tout comprendre c'est tout pardonner' [to understand all is to forgive all], I can reply that it is only a temporary suspense of ethical judgment, made because 'beaucoup condamner c'est peu comprendre' [to condemn much is to understand little]."
查看中文翻译
(3) 对致命争斗的统计:第一集,战争的时机 The Statistics of Deadly Quarrels, Part 1: the Timing of Wars | 人性中的善良天使
2 / 22
Thinginess failures are familiar to physicists, and Richardson handled them with two techniques of mathematical estimation. Rather than seeking an elusive "precise definition" of a war, he gave the average priority over the individual case: as he considered each unclear conflict in turn, he systematically flipped back and forth between lumping them into one quarrel and splitting them into two, figuring that the errors would cancel out in the long run. (It's the same principle that underlies the practice of rounding a number ending in 5 to the closest even digit -- half the time it will go up, half the time down.) And borrowing a practice from astronomy, Richardson assigned each quarrel a magnitude, namely the base-ten logarithm (roughly, the number of zeroes) of the war's death toll. On a logarithmic scale, a certain degree of imprecision in the measurements doesn't matter as much as it does on a conventional linear scale. For example, uncertainty over whether a war killed 100,000 or 200,000 people translates to an uncertainty in magnitude of only 5 versus 5.3. So Richardson sorted the magnitudes into logarithmic pigeonholes: 2.5 to 3.5 (that is, between 316 and 3,162 deaths), 3.5 to 4.5 (3,163 to 31,622), and so on. The other advantage of a logarithmic scale is that it allows us to visualize quarrels of a variety of sizes, from turf battles to world wars, on a single scale.
查看中文翻译
(3) 对致命争斗的统计:第一集,战争的时机 The Statistics of Deadly Quarrels, Part 1: the Timing of Wars | 人性中的善良天使
3 / 22
Richardson bemoaned an important gap in the historical record: the feuds, raids, and skirmishes that killed between 4 and 315 people apiece (magnitude 0.5 to 2.5), which were too big for criminologists to record but too small for historians. He illustrated the problem of these quarrels beneath the military horizon by quoting from Reginald Coupland's history of the East African slave trade:
查看中文翻译
Richardson also faced the problem of what kinds of quarrels to include, which deaths to tally, and how low to go. His criterion for adding a historical event to his database was "malice aforethought," so he included wars of all kinds and sizes, as well as mutinies, insurrections, lethal riots, and genocides; that's why he called his units of analysis "deadly quarrels" instead of haggling over what really deserves the word "war." His magnitude figures included soldiers killed on the battlefield, civilians killed deliberately or as collateral damage, and deaths of soldiers from disease or exposure; he did not count civilian deaths from disease or exposure since these are more properly attributed to negligence than to malice.
查看中文翻译
(3) 对致命争斗的统计:第一集,战争的时机 The Statistics of Deadly Quarrels, Part 1: the Timing of Wars | 人性中的善良天使
4 / 22
"The main sources of supply were the organized slave-raids in the chosen areas, which shifted steadily inland as tract after tract became 'worked out.' The Arabs might conduct a raid themselves, but more usually they incited a chief to attack another tribe, lending him their own armed slaves and guns to ensure his victory. The result, of course, was an increase in intertribal warfare till 'the whole country was in a flame.'"
查看中文翻译
Nor were they available for 80 revolutions in Latin America, 556 peasant uprisings in Russia, and 477 conflicts in China, which Richardson knew about but was forced to exclude from his tallies.
查看中文翻译
How should this abominable custom be classified? Was it all one huge war between Arabs and Negroes which began two thousand years before it ended in 1880? If so it may have caused more deaths than any other war in history. From Coupland's description, however, it would seem more reasonable to regard slave-raiding as a numerous collection of small fatal quarrels each between an Arab caravan and a negro tribe or village, and of magnitudes such as 1, 2, or 3. Detailed statistics are not available.
查看中文翻译
(3) 对致命争斗的统计:第一集,战争的时机 The Statistics of Deadly Quarrels, Part 1: the Timing of Wars | 人性中的善良天使
5 / 22
Richardson did, however, anchor the scale at magnitude 0 by including statistics on homicides, which are quarrels with a death toll of 1 (since 10° = 1). He anticipates an objection by Shakespeare's Portia: "You ought not to mix up murder with war; for murder is an abominable selfish crime, but war is a heroic and patriotic adventure." He replies: "Yet they are both fatal quarrels. Does it never strike you as puzzling that it is wicked to kill one person, but glorious to kill ten thousand?"
查看中文翻译
Richardson then analyzed the 315 quarrels (without the benefit of a computer) to get a bird's-eye view of human violence and test a variety of hypotheses suggested by historians and his own prejudices. Most of the hypotheses did not survive their confrontation with the data. A common language didn't make two factions less likely to go to war (just think of most civil wars, or the 19th-century wars between South American countries); so much for the "hope" that gave Esperanto its name. Economic indicators predicted little; rich countries, for example, didn't systematically pick on poor countries or vice versa. Wars were not, in general, precipitated by arms races.
查看中文翻译
(3) 对致命争斗的统计:第一集,战争的时机 The Statistics of Deadly Quarrels, Part 1: the Timing of Wars | 人性中的善良天使
6 / 22
But a few generalizations did survive. A long-standing government inhibits fighting: peoples on one side of a national border are less likely to have a civil war than peoples on opposite sides are to have an interstate war. Countries are more likely to fight their neighbors, but great powers are more likely to fight everyone, largely because their far-flung empires make almost everyone their neighbors. Certain cultures, especially those with a militant ideology, are particularly prone to go to war.
查看中文翻译
But Richardson's most enduring discoveries are about the statistical patterning of wars. Three of his generalizations are robust, profound, and underappreciated. To understand them, we must first take a small detour into a paradox of probability.
查看中文翻译
Suppose you live in a place that has a constant chance of being struck by lightning at any time throughout the year. Suppose that the strikes are random: every day the chance of a strike is the same, and the rate works out to one strike a month. Your house is hit by lightning today, Monday. What is the most likely day for the next bolt to strike your house?
查看中文翻译
(3) 对致命争斗的统计:第一集,战争的时机 The Statistics of Deadly Quarrels, Part 1: the Timing of Wars | 人性中的善良天使
7 / 22
The answer is "tomorrow," Tuesday. That probability, to be sure, is not very high; let's approximate it at 0.03 (about once a month). Now think about the chance that the next strike will be the day after tomorrow, Wednesday. For that to happen, two things have to take place. First lightning has to strike on Wednesday, a probability of 0.03. Second, lightning can't have struck on Tuesday, or else Tuesday would have been the day of the next strike, not Wednesday. To calculate that probability, you have to multiply the chance that lightning will not strike on Tuesday (0.97, or 1 minus 0.03) by the chance that lightning will strike on Wednesday (0.03), which is 0.0291, a bit lower than Tuesday's chances. What about Thursday? For that to be the day, lightning can't have struck on Tuesday (0.97) or on Wednesday either (0.97 again) but it must strike on Thursday, so the chances are 0.97 × 0.97 × 0.03, which is 0.0282. What about Friday? It's 0.97 × 0.97 × 0.97 × 0.03, or 0.274. With each day, the odds go down (0.0300… 0.0291… 0.0282… 0.0274), because for a given day to be the next day that lightning strikes, all the previous days have to have been strike-free, and the more of these days there are, the lower the chances are that the streak will continue. To be exact, the probability goes down exponentially, accelerating at an accelerating rate. The chance that the next strike will be thirty days from today is 0.97 × 0.03, barely more than 1 percent.
查看中文翻译
(3) 对致命争斗的统计:第一集,战争的时机 The Statistics of Deadly Quarrels, Part 1: the Timing of Wars | 人性中的善良天使
8 / 22
Almost no one gets this right. I gave the question to a hundred Internet users, with the word next italicized so they couldn't miss it. Sixty-seven picked the option "every day has the same chance." But that answer, though intuitively compelling, is wrong. If every day were equally likely to be the next one, then a day a thousand years from now would be just as likely as a day a month from now. That would mean that the house would be just as likely to go a thousand years without a strike as to suffer one next month. Of the remaining respondents, nineteen thought that the most likely day was a month from today. Only five of the hundred correctly guessed "tomorrow."
查看中文翻译
Lightning strikes are an example of what statisticians call a Poisson process (pronounced pwah-sonh), named after the 19th-century mathematician and physicist Siméon-Denis Poisson. In a Poisson process, events occur continuously, randomly, and independently of one another. Every instant the lord of the sky, Jupiter, rolls the dice, and if they land snake eyes he hurls a thunderbolt. The next instant he rolls them again, with no memory of what happened the moment before. For reasons we have just seen, in a Poisson process the intervals between events are distributed exponentially: there are lots of short intervals and fewer and fewer of them as they get longer and longer. That implies that events that occur at random will seem to come in clusters, because it would take a nonrandom process to space them out.
查看中文翻译
(3) 对致命争斗的统计:第一集,战争的时机 The Statistics of Deadly Quarrels, Part 1: the Timing of Wars | 人性中的善良天使
9 / 22
The London Blitz. Feller recounts that during the Blitz in World War II, Londoners noticed that a few sections of the city were hit by German V-2 rockets many times, while others were not hit at all. They were convinced that the rockets were targeting particular kinds of neighborhoods. But when statisticians divided a map of London into small squares and counted the bomb strikes, they found that the strikes followed the distribution of a Poisson process -- the bombs, in other words, were falling at random. The episode is depicted in Thomas Pynchon's 1973 novel Gravity's Rainbow, in which statistician Roger Mexico has correctly predicted the distribution of bomb strikes, though not their exact locations. Mexico has to deny that he is a psychic and fend off desperate demands for advice on where to hide.
查看中文翻译
This cognitive illusion was first noted in 1968 by the mathematician William Feller in his classic textbook on probability: "To the untrained eye, randomness appears as regularity or tendency to cluster." Here are a few examples of the cluster illusion.
查看中文翻译
The human mind has great difficulty appreciating this law of probability. When I was a graduate student, I worked in an auditory perception lab. In one experiment listeners had to press a key as quickly as possible every time they heard a beep. The beeps were timed at random, that is, according to a Poisson process. The listeners, graduate students themselves, knew this, but as soon as the experiment began they would run out of the booth and say, "Your random event generator is broken. The beeps are coming in bursts. They sound like this: "beepbeepbeepbeepbeep… beep… beepbeep… beepitybeepitybeepbeepbeep." They didn't appreciate that that's what randomness sounds like.
查看中文翻译
(3) 对致命争斗的统计:第一集,战争的时机 The Statistics of Deadly Quarrels, Part 1: the Timing of Wars | 人性中的善良天使
10 / 22
The birthday paradox. Most people are surprised to learn that if there are at least 23 people in a room, the chances that two of them will share a birthday are better than even. With 57 people, the probability rises to 99 percent. In this case the illusory clusters are in the calendar. There are only so many birthdays to go around (366), so a few of the birthdays scattered throughout the year are bound to fall onto the same day, unless there was some mysterious force trying to separate them.
查看中文翻译
The gambler's fallacy. Many high rollers lose their fortunes because of the gambler's fallacy: the belief that after a run of similar outcomes in a game of chance (red numbers in a roulette wheel, sevens in a game of dice), the next spin or toss is bound to go the other way. Tversky and Kahneman showed that people think that genuine sequences of coin flips (like TTHHTHTTTT) are fixed, because they have more long runs of heads or of tails than their intuitions allow, and they think that sequences that were jiggered to avoid long runs (like HTHTTHTHHT) are fair.
查看中文翻译
(3) 对致命争斗的统计:第一集,战争的时机 The Statistics of Deadly Quarrels, Part 1: the Timing of Wars | 人性中的善良天使
11 / 22
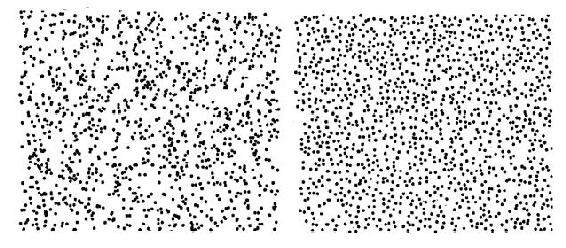
Constellations. My favorite example was discovered by the biologist Stephen Jay Gould when he toured the famous glowworm caves in Waitomo, New Zealand. The worms' pinpricks of light on the dark ceiling made the grotto look like a planetarium, but with one difference: there were no constellations. Gould deduced the reason. Glowworms are gluttonous and will eat anything that comes within snatching distance, so each worm gives the others a wide berth when it stakes out a patch of ceiling. As a result, they are more evenly spaced than stars, which from our vantage point are randomly spattered across the sky. Yet it is the stars that seem to fall into shapes, including the ram, bull, twins, and so on, that for millennia have served as portents to pattern-hungry brains. Gould's colleague, the physicist Ed Purcell, confirmed Gould's intuition by programming a computer to generate two arrays of random dots. The virtual stars were plonked on the page with no constraints. The virtual worms were given a random tiny patch around them in which no other worm could intrude. They are shown in figure 5-5; you can probably guess which is which. The one on the left, with the clumps, strands, voids, and filaments (and perhaps, depending on your obsessions, animals, nudes, or Virgin Marys) is the array that was plotted at random, like stars. The one on the right, which seems to be haphazard, is the array whose positions were nudged apart, like glowworms.
查看中文翻译
(3) 对致命争斗的统计:第一集,战争的时机 The Statistics of Deadly Quarrels, Part 1: the Timing of Wars | 人性中的善良天使
12 / 22
Sources: Displays generated by Ed Purcell; reproduced from Gould, 1991, pp. 266-67.
查看中文翻译
Richardson's data. My last example comes from another physicist, our friend Lewis Fry Richardson. These are real data from a naturally occurring phenomenon. The segments in figure 5-6 represent events of various durations, and they are arranged from left to right in time and from bottom to top in magnitude. Richardson showed that the events are governed by a Poisson process: they stop and start at random. Your eye may discern some patterns -- for example, a scarcity of segments at the top left, and the two floaters at the top right. But by now you have learned to distrust these apparitions. And indeed Richardson showed that there was no statistically significant trend in the distribution of magnitudes from the beginning of the sequence to the end. Cover up the two outliers with your thumb, and the impression of randomness is total.
查看中文翻译
FIGURE 5-5: Random and nonrandom patterns
查看中文翻译
(3) 对致命争斗的统计:第一集,战争的时机 The Statistics of Deadly Quarrels, Part 1: the Timing of Wars | 人性中的善良天使
13 / 22
Source: Graph from Hayes, 2002, based on data in Richardson, 1960.
查看中文翻译
Richardson's major discovery about the timing of wars is that they begin at random. Every instant Mars, the god of war, rolls his iron dice, and if they turn up snake eyes he sends a pair of nations to war. The next instant he rolls them again, with no memory of what happened the moment before. That would make the distribution of intervals between war onsets exponential, with lots of short intervals and fewer long ones.
查看中文翻译
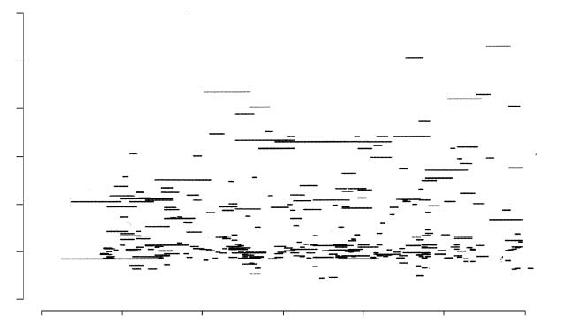
FIGURE 5-6: Richardson's data
查看中文翻译
You can probably guess what the data represent. Each segment is a war. The horizontal axis marks off quarter-centuries from 1800 to 1950. The vertical axis indicates the magnitude of the war, measured as the base-ten logarithm of the number of deaths, from two at the bottom (a hundred deaths) to eight at the top (a hundred million deaths). And the two segments in the upper right correspond to World War I and World War II.
查看中文翻译
(3) 对致命争斗的统计:第一集,战争的时机 The Statistics of Deadly Quarrels, Part 1: the Timing of Wars | 人性中的善良天使
14 / 22
Richardson found that not only are the onsets of wars randomly timed; so are their offsets. At every instant Pax, the goddess of peace, rolls her dice, and if they come up boxcars, the warring parties lay down their arms. Richardson found that once a small war (magnitude 3) begins, then every year there is a slightly less than even chance (0.43) that it will terminate. That means that most wars last a bit more than two years, right? If you're nodding, you haven't been paying attention! With a constant probability of ending every year, a war is most likely to end after its first year, slightly less likely to end within two years, a bit less likely to stretch on to three, and so on. The same is true for larger wars (magnitude 4 to 7), which have a 0.235 chance of coming to an end before another year is up. War durations are distributed exponentially, with the shortest wars being the most common. This tells us that warring nations don't have to "get the aggression out of their system" before they come to their senses, that wars don't have a "momentum" that must be allowed to "play itself out." As soon as a war begins, some combination of antiwar forces -- pacifism, fear, rout -- puts pressure on it to end.
查看中文翻译
The Poisson nature of war undermines historical narratives that see constellations in illusory clusters. It also confounds theories that see grand patterns, cycles, and dialectics in human history. A horrible conflict doesn't make the world weary of war and give it a respite of peaceable exhaustion. Nor does a pair of belligerents cough on the planet and infect it with a contagious war disease. And a world at peace doesn't build up a mounting desire for war, like an unignorable itch, that eventually must be discharged in a sudden violent spasm. No, Mars just keeps rolling the dice. Some half-dozen other war datasets have been assembled during and after Richardson's time; all support the same conclusion.
查看中文翻译
(3) 对致命争斗的统计:第一集,战争的时机 The Statistics of Deadly Quarrels, Part 1: the Timing of Wars | 人性中的善良天使
15 / 22
If wars start and stop at random, is it pointless even to look for historical trends in war? It isn't. The "randomness" in a Poisson process pertains to the relationships among successive events, namely that there is none: the event generator, like the dice, has no memory. But nothing says that the probability has to be constant over long stretches of time. Mars could switch from causing a war whenever the dice land in snake eyes to, say, causing a war whenever they add up to 3, or 6, or 7. Any of these shifts would change the probability of war over time without changing its randomness -- the fact that the outbreak of one war doesn't make another war either more or less likely. A Poisson process with a drifting probability is called nonstationary. The possibility that war might decline over some historical period, then, is alive. It would reside in a nonstationary Poisson process with a declining rate parameter.
查看中文翻译
By the same token, it's mathematically possible for war both to be a Poisson process and to display cycles. In theory, Mars could oscillate, causing a war on 3 percent of his throws, then shifting to causing a war on 6 percent, and then going back again. In practice, it isn't easy to distinguish cycles in a nonstationary Poisson process from illusory clusters in a stationary one. A few clusters could fool the eye into thinking that the whole system waxes and wanes (as in the so-called business cycle, which is really a sequence of unpredictable lurches in economic activity rather than a genuine cycle with a constant period). There are good statistical methods that can test for periodicities in time series data, but they work best when the span of time is much longer than the period of the cycles one is looking for, since that provides room for many of the putative cycles to fit. To be confident in the results, it also helps to have a second dataset in which to replicate the analysis, so that one isn't fooled by the possibility of "overfitting" cycles to what are really random clusters in a particular dataset. Richardson examined a number of possible cycles for wars of magnitudes 3, 4, and 5 (the bigger wars were too sparse to allow a test), and found none. Other analysts have looked at longer datasets, and the literature contains sightings of cycles at 5, 15, 20, 24, 30, 50, 60, 120, and 200 years. With so many tenuous candidates, it is safer to conclude that war follows no meaningful cycle at all, and that is the conclusion endorsed by most quantitative historians of war. The sociologist Pitirim Sorokin, another pioneer of the statistical study of war, concluded, "History seems to be neither as monotonous and uninventive as the partisans of the strict periodicities and 'iron laws' and 'universal uniformities' think; nor so dull and mechanical as an engine, making the same number of revolutions in a unit of time."
查看中文翻译
(3) 对致命争斗的统计:第一集,战争的时机 The Statistics of Deadly Quarrels, Part 1: the Timing of Wars | 人性中的善良天使
16 / 22
Could the 20th-century Hemoclysm, then, have been some kind of fluke? Even to think that way seems like monstrous disrespect to the victims. But the statistics of deadly quarrels don't force such an extreme conclusion. Randomness over long stretches of time can coexist with changing probabilities, and certainly some of the probabilities in the 1930s must have been different from those of other decades. The Nazi ideology that justified an invasion of Poland in order to acquire living space for the "racially superior" Aryans was a part of the same ideology that justified the annihilation of the "racially inferior" Jews. Militant nationalism was a common thread that ran through Germany, Italy, and Japan. There was also a common denominator of counter-Enlightenment utopianism behind the ideologies of Nazism and communism. And even if wars are randomly distributed over the long run, there can be an occasional exception. The occurrence of World War I, for example, presumably incremented the probability that a war like World War II in Europe would break out.
查看中文翻译
(3) 对致命争斗的统计:第一集,战争的时机 The Statistics of Deadly Quarrels, Part 1: the Timing of Wars | 人性中的善良天使
17 / 22
Writing in 1999, White repeated a Frequently Asked Question of that year: "Who's the most important person of the Twentieth Century?" His choice: Gavrilo Princip. Who the heck was Gavrilo Princip? He was the nineteen-year-old Serb nationalist who assassinated Archduke Franz Ferdinand of Austria-Hungary during a state visit to Bosnia, after a string of errors and accidents delivered the archduke to within shooting distance. White explains his choice:
查看中文翻译
But statistical thinking, particularly an awareness of the cluster illusion, suggests that we are apt to exaggerate the narrative coherence of this history -- to think that what did happen must have happened because of historical forces like cycles, crescendos, and collision courses. Even with all the probabilities in place, highly contingent events, which need not reoccur if we somehow could rewind the tape of history and play it again, may have been necessary to set off the wars with death tolls in the 6s and 7s on the magnitude scale.
查看中文翻译
Here's a man who single-handedly sets off a chain reaction which ultimately leads to the deaths of 80 million people.
查看中文翻译
(3) 对致命争斗的统计:第一集,战争的时机 The Statistics of Deadly Quarrels, Part 1: the Timing of Wars | 人性中的善良天使
18 / 22
Other historians who indulge in counterfactual scenarios, such as Richard Ned Lebow, have made similar arguments. As for World War II, the historian F. H. Hinsley wrote, "Historians are, rightly, nearly unanimous that… the causes of the Second World War were the personality and the aims of Adolf Hitler." Keegan agrees: "Only one European really wanted war -- Adolf Hitler." The political scientist John Mueller concludes:
查看中文翻译
With just a couple of bullets, this terrorist starts the First World War, which destroys four monarchies, leading to a power vacuum filled by the Communists in Russia and the Nazis in Germany who then fight it out in a Second World War…
查看中文翻译
Top that, Albert Einstein!
查看中文翻译
Some people would minimize Princip's importance by saying that a Great Power War was inevitable sooner or later given the tensions of the times, but I say that it was no more inevitable than, say, a war between NATO and the Warsaw Pact. Left unsparked, the Great War could have been avoided, and without it, there would have been no Lenin, no Hitler, no Eisenhower.
查看中文翻译
(3) 对致命争斗的统计:第一集,战争的时机 The Statistics of Deadly Quarrels, Part 1: the Timing of Wars | 人性中的善良天使
19 / 22
These statements suggest that there was no momentum toward another world war in Europe, that historical conditions in no important way required that contest, and that the major nations of Europe were not on a collision course that was likely to lead to war. That is, had Adolf Hitler gone into art rather than politics, had he been gassed a bit more thoroughly by the British in the trenches in 1918, had he, rather than the man marching next to him, been gunned down in the Beer Hall Putsch of 1923, had he failed to survive the automobile crash he experienced in 1930, had he been denied the leadership position in Germany, or had he been removed from office at almost any time before September 1939 (and possibly even before May 1940), Europe's greatest war would most probably never have taken place.
查看中文翻译
So, too, the Nazi genocide. As we shall see in the next chapter, most historians of genocide agree with the title of a 1984 essay by the sociologist Milton Himmelfarb: "No Hitler, no Holocaust."
查看中文翻译
Probability is a matter of perspective. Viewed at sufficiently close range, individual events have determinate causes. Even a coin flip can be predicted from the starting conditions and the laws of physics, and a skilled magician can exploit those laws to throw heads every time. Yet when we zoom out to take a wide-angle view of a large number of these events, we are seeing the sum of a vast number of causes that sometimes cancel each other out and sometimes align in the same direction. The physicist and philosopher Henri Poincaré explained that we see the operation of chance in a deterministic world either when a large number of puny causes add up to a formidable effect, or when a small cause that escapes our notice determines a large effect that we cannot miss. In the case of organized violence, someone may want to start a war; he waits for the opportune moment, which may or may not come; his enemy decides to engage or retreat; bullets fly; bombs burst; people die. Every event may be determined by the laws of neuroscience and physics and physiology. But in the aggregate, the many causes that go into this matrix can sometimes be shuffled into extreme combinations. Together with whatever ideological, political, and social currents put the world at risk in the first half of the 20th century, those decades were also hit with a run of extremely bad luck.
查看中文翻译
(3) 对致命争斗的统计:第一集,战争的时机 The Statistics of Deadly Quarrels, Part 1: the Timing of Wars | 人性中的善良天使
20 / 22
Now to the money question: has the probability that a war will break out increased, decreased, or stayed the same over time? Richardson's dataset is biased to show an increase. It begins just after the Napoleonic Wars, slicing off one of the most destructive wars in history at one end, and finishes just after World War II, snagging history's most destructive war at the other. Richardson did not live to see the Long Peace that dominated the subsequent decades, but he was an astute enough mathematician to know that it was statistically possible, and he devised ingenious ways of testing for trends in a time series without being misled by extreme events at either end. The simplest was to separate the wars of different magnitudes and test for trends separately in each range. In none of the five ranges (3 to 7) did he find a significant trend. If anything, he found a slight decline. "There is a suggestion," he wrote, "but not a conclusive proof, that mankind has become less warlike since A. D. 1820. The best available observations show a slight decrease in the number of wars with time… But the distinction is not great enough to show plainly among chance variations." Written at a time when the ashes of Europe and Asia were still warm, this is a testament to a great scientist's willingness to lets facts and reason override casual impressions and conventional wisdom.
查看中文翻译
(3) 对致命争斗的统计:第一集,战争的时机 The Statistics of Deadly Quarrels, Part 1: the Timing of Wars | 人性中的善良天使
21 / 22
As we shall see, analyses of the frequency of war over time from other datasets point to the same conclusion. But the frequency of war is not the whole story; magnitude matters as well. One could be forgiven for pointing out that Richardson's conjecture that mankind was getting less warlike depended on segregating the world wars into a micro-class of two, in which statistics are futile. His other analyses counted all wars alike, with World War II no different from, say, a 1952 revolution in Bolivia with a thousand deaths. Richardson's son pointed out to him that if he divided his data into large and small wars, they seemed to show opposing trends: small wars were becoming considerably less frequent, but larger wars, while fewer in number, were becoming somewhat more frequent. A different way of putting it is that between 1820 and 1953 wars became less frequent but more lethal. Richardson tested the pattern of contrast and found that it was statistically significant. The next section will show that this too was an astute conclusion: other datasets confirm that until 1945, the story of war in Europe and among major nations in general was one of fewer but more damaging wars.
查看中文翻译
(3) 对致命争斗的统计:第一集,战争的时机 The Statistics of Deadly Quarrels, Part 1: the Timing of Wars | 人性中的善良天使
22 / 22
So does that mean that mankind got more warlike or less? There is no single answer, because "warlike" can refer to two different things. It can refer to how likely nations are to go to war, or it can refer to how many people are killed when they do. Imagine two rural counties with the same size population. One of them has a hundred teenage arsonists who delight in setting forest fires. But the forests are in isolated patches, so each fire dies out before doing much damage. The other county has just two arsonists, but its forests are connected, so that a small blaze is likely to spread, as they say, like wildfire. Which county has the worse forest fire problem? One could argue it either way. As far as the amount of reckless depravity is concerned, the first county is worse; as far as the risk of serious damage is concerned, the second is. Nor is it obvious which county will have the greater amount of overall damage, the one with a lot of little fires, or the one with a few big ones. To make sense of these questions, we have to turn from the statistics of time to the statistics of magnitude.
查看中文翻译